Run your cancer program on real-time insight
OncoLens gives you a live view of patient journeys, quality performance, and growth opportunities across every facility, so you and your teams can act while it still matters. Built in close partnership with leaders like you.
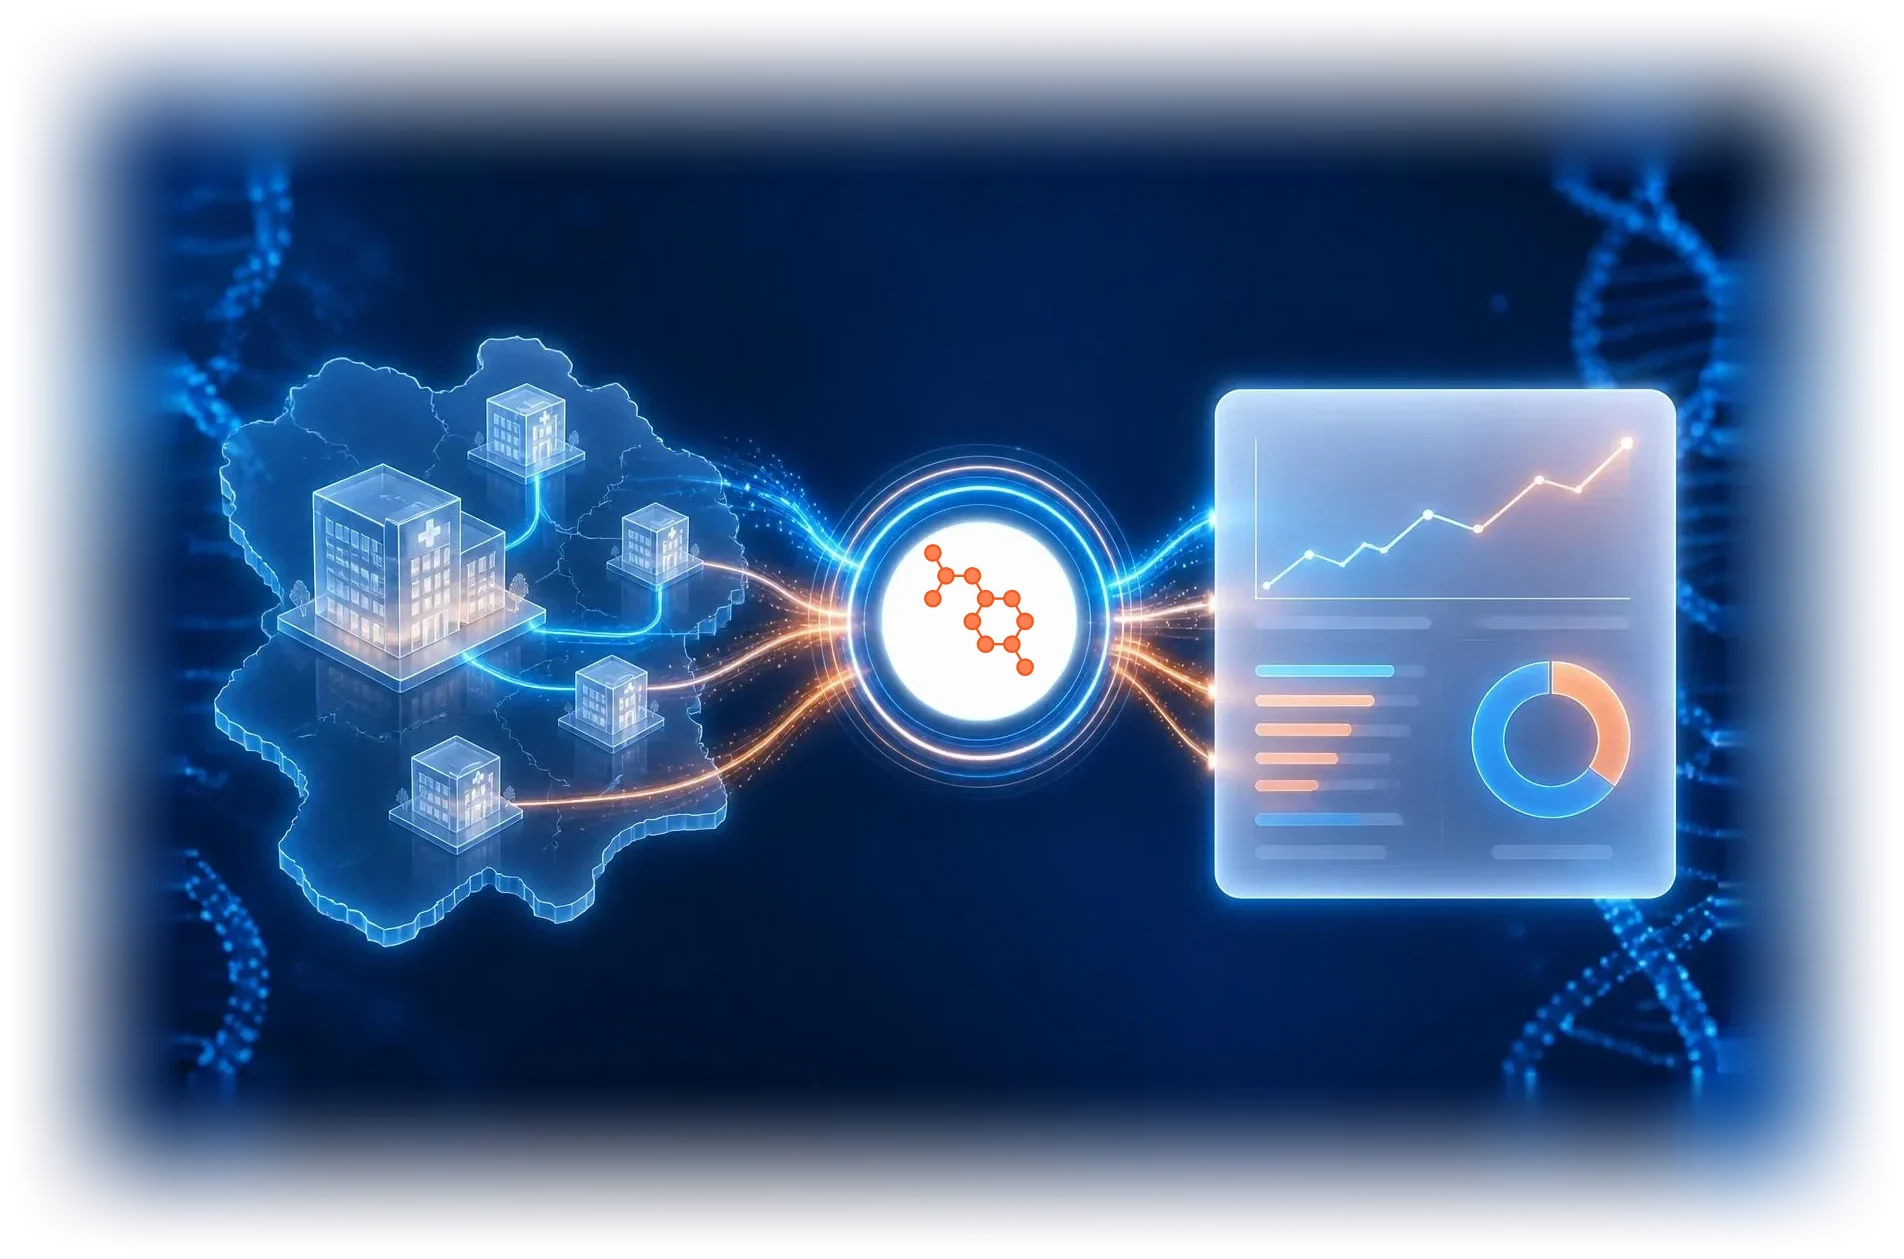
OncoLens results for Cancer Executives
Where value hides in the patient journey
Referral and finding
Diagnosis and workup
Tumor board
Treatment
Survivorship and registry
One platform for the whole cancer service line
Service line analytics
- Patient cohort dashboards by diagnosis and facility track patient volume, testing and treatment patterns, all in one consolidated digital compendium.
- If we don’t have something on the shelf, we use the same infrastructure to build the agent you need.
Find hidden delays and gaps
- Surface patients who are stalled, untested, or off-guideline, so you can direct navigation teams to intervene before outcomes are affected.
- Integrations into Elsevier's ClinicalPath and supportive care guidelines enable immediate tracking and adjustment.
Standardize across sites
- Derive efficiencies by bringing every location and disease type onto a consistent tumor board and care navigation workflow.
- Built on evidence-based protocols.
Grow in-network referrals
- Engage your catchment area through e-consults, tumor boards and secure information exchange.
- Know when and where to provide the support your affiliates need.
Grow accruals and optimize revenue
- Improve timely patient access to clinical trials, CAR-T, supportive care and more through OncoLens automated matching to guidelines and protocols.
- All patient-id services involve a “human in the loop” to provide maximum support to your care teams.
The real-time aspect of OncoLens Analytics has transitioned my workflow from collection to high value clinical intervention by identifying patients with a single line of clinically relevant and now surfaced data. The patients can now be discussed at conferences and in other treatment planning meetings.






























Case studies

Visibility That Drives Improvement: How AI Surfaces Hidden Delays in Cancer Care
An academic cancer center moved from data curation to data-driven action across three care pathways and over 10.2 million data points.
Read the full case study →
How Real-Time Referral Data Transformed Breast Cancer Care at a Leading Academic Center
A Florida academic cancer center used the OncoLens Referral Report to track referral-to-consult timelines in real time, leading to faster interventions, better NAPBC compliance, and improved patient experiences.
Read the full case study →Frequently asked questions
What is oncology service line analytics?
Oncology service line analytics tracks how patients move through a cancer program, including volume, time to treatment, testing rates, guideline concordance, and referral patterns. OncoLens builds these views from structured EHR fields and unstructured pathology, radiology, and clinical notes, so leaders see where patients actually are, not just what was coded.
What does OncoLens give cancer center leadership that our EHR reports don’t?
Most EHR reporting relies on structured fields. OncoLens reads pathology, radiology, and clinical notes as well, so dashboards reflect delays, missed testing, and off-guideline care that never shows up in a standard report.
Can OncoLens show performance across multiple sites and disease teams?
Yes. Cohort dashboards can be filtered by facility, diagnosis, and disease team, giving leaders a consistent view across locations and a common workflow to standardize against.
How does OncoLens help reduce patient leakage?
By tracking referrals, tumor board activity, and e-consults across your catchment area, OncoLens helps leaders see where patients move out of network and where affiliate practices need support to keep care local.
How does OncoLens connect to revenue and growth goals?
Automated matching to clinical trials, CAR-T, supportive care, and guideline-based testing helps eligible patients reach services your program already offers, improving access for patients and utilization of your investments.
Explore other audiences
OncoLens supports every team across the cancer program.
Physicians & Tumor Board Teams
Less time on prep. Confidence that no patient falls through the cracks.
AudienceNavigators & Care Teams
Clarity on every patient, ready for your care.
AudienceRegistry & Quality Teams
Abstract faster. Report sooner. Stay survey ready.
AudienceResearch & Clinical Trial Leaders
We get the complexity of Oncology trials.
AudienceIT, Data & AI Leaders
Oncology AI that scales with your needs and fits your governance.
See your entire cancer program in one view.
Get a walkthrough of OncoLens Analytics using the metrics your board and leadership team care about.